Libraries col?lect a?lot of data that encom?pass com?plex net?works about how users nav?i?gate through online resources, which sub?jects cir?cu?late the most or the least, which resources are requested via inter?li?brary loan, vis?i?ta?tion pat?terns over peri?ods of time, ref?er?ence queries, and usage sta?tis?tics of online jour?nals and data?bases. Mak?ing sense of these com?plex net?works of use and need isn?t easy. But the rela?tion?ships between use and need pat?terns can help libraries make hard deci?sions…
What if our transaction logs looked more like this?
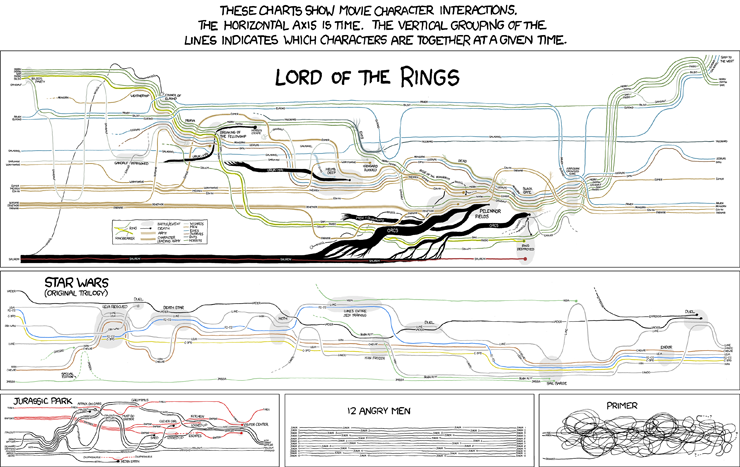
Read more from Not Just Another Pretty Picture by Hilary Davis.
Do you have any data to present?? If you try out one of Hilary’s tools, leave us a link!