At this very moment, a team of intrepid scientists, artists, and adventurers are traversing one of the world’s most untouched habitats: Botswana’s Okavango Delta and its dangerous source rivers, the Cuito and the Cubana. Beginning with a wetland bird survey in 2012, The Okavango Wilderness Project has been undertaking yearly expeditions to the Okavango, and these expeditions have been expanding in scope every year. Now, on the 2015 trip, the Cuito River is receiving particular attention. Due to a 27 year long Angolan civil war (which ended in 2002), the lands along the river are seeded with live land mines. The explorers aim to travel the full length of the river, a feat never before attempted due to its inhospitability. They hope to raise awareness of the many conservation issues affecting the Delta and its source rivers, advocate for legislative protections, gather useful scientific data, and share the cultures of those who live near the Delta. To these ends they have assembled a crew with a diverse set of specialties: ichthyologists, ornithologists, herpetologists, botanists, photographers, polers, and more. Of special interest to Unbound is their data artist, Jer Thorp, and the data reporting methods he has orchestrated.
https://instagram.com/p/21Qi3XGnIh/
This year, the Into the Okavango expedition is recording and broadcasting a very thorough suite of data. Their mekoro (a kind of specialized canoe) are equipped with GPS sensors that record their locations at all times. Members of the crew are wearing heart rate monitors that record their biometrics. They have brought a Data Boat equipped with sensors that measure water and air quality. They are uploading photos to Instagram, tweeting, and creating podcasts and field recordings. As they reach certain planned points on their route, they are deploying stationary, autonomous, solar-powered sensor platforms that will automatically record water temperature and pH over time, and report back over the internet.
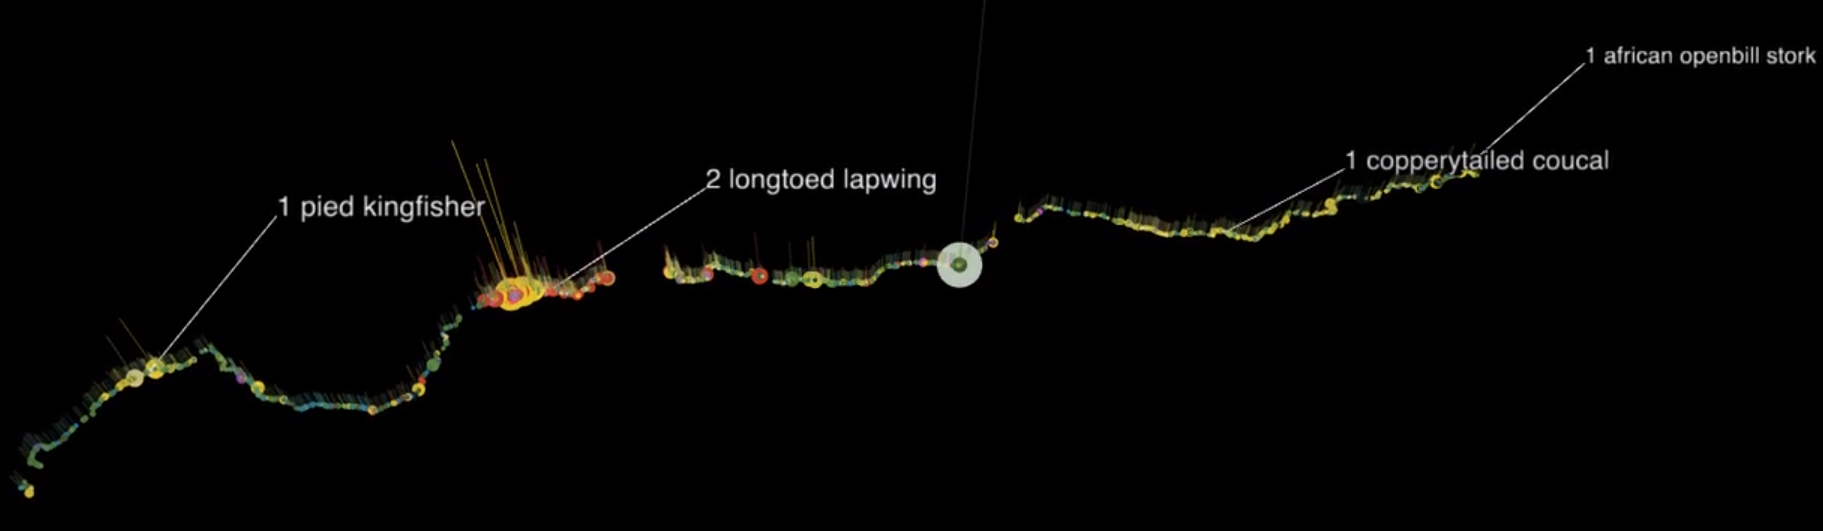
Their process for recording animal sightings is particularly clever. When one of their experts spots an animal of interest they call out the species name and use a custom-made android app to take photos of it and report the sighting. The app sends the data to a Raspberry Pi computer in the back of the boat, and then an antenna connected to the Pi sends the data to the internet. The sightings incorporate GPS data so you can track where each one occurred along the route, allowing for maps of sightings like the one at the top of this post. Some of the large corpus of data they collect is reported live, but most of it reaches the internet in one transmission every evening. When the explorers have made camp they sort through the records of the day and upload it to the expedition’s website.
All of the data uploaded to the website is comprehensive and completely open to the public. The site features an interactive map that intuitively displays the crew’s geographic location over time, paired with their photos, tweets, and wildlife sightings. They also provide an open API which allows anyone to interface with the complete database using their own software. By providing such immediate and open access, the expedition team hopes that they’ll allow people at home to have a personal relationship with the research data, and by extension the Okavango Delta itself. Ideally, their data will persist as a legacy for future researchers to use in ways they’d never expected.
https://instagram.com/p/3PAl5UGnOF/?taken-by=intotheokavango
I first became aware of Jer Thorp’s work when he visited Simmons College for the IMLS-sponsored conference Envisioning Our Information Future and How to Educate for it. His experience as an artist embedded in information institutions lent him a valuable perspective on the issues and ideas we discussed there. He is known for his software-based art that visualizes and conceptualizes scientific data in creative ways. His Sustained Silent Reading, a 2010 installation at the Gottesman Library at Columbia University, used semantic analysis to find important people, places, and things in a text and display their relationships in a stylized diagram. His contributions to Manhattan’s 9/11 Memorial allowed for the organization of victim’s names by their relationships to each other, with coworkers and family members’ names placed together. Since 2013, Thorp has been lending his talent for data manipulation to The Okavango Wilderness Project.
Thorp did not physically attend their 2013 expedition, but he created an open API for their data from home, allowing anyone following along from their computers the ability to create their own tools and visualizations using the data. In 2014 he expanded this API and traveled with the explorers, helping them report their data in real-time. At one rather notable point during that trip he ended up facing off with a hippopotamus one on one. Undaunted, he returned in 2015 to refine the team’s process for reporting data and to assist them in the field.
After spending several weeks preparing the expedition’s technology and venturing on the first leg of the journey, Thorp’s segment of this year’s trip ended on the 28th of May. The systems he designed will continue to serve up data for the rest of the expedition.
Thorp’s design of the expedition’s data workflow could provide a blueprint for librarians with an interest in real-time open access data. In this expedition, Thorp’s job facilitating his colleagues’ research was not entirely dissimilar to a faculty services librarian’s role when supporting academic research. Librarians’ expertise in information seeking, manipulating data, and facilitating information access could make them good candidates for joining future expeditions of this type. Perhaps the time is right for a new breed of adventure librarian?
If you’ve heard of any librarians undertaking similar projects, let us know in the comments!
(Post by Derek Murphy)
Fantastic. I have been following intotheOkavango from the beginning. This kind of social and scientific engagement is more essential now than ever. I have always wanted to see the Okavango and now, in a way, I am. I am for the most part a dance and arts writer. But I am on the edge of my seat watching this expedition unfold. Thanks for the story.
“Exploring the data streams from the Okavango Delta offers fascinating insights into the region’s ecosystem, and it’s amazing to see how technology can help us monitor and analyze such vital data. Platforms like Couponlords might not immediately come to mind when we think of environmental research, but they show how innovative tech can support conservation efforts. Whether it’s through offering discounts for eco-friendly purchases or promoting awareness about the Okavango Delta’s delicate environment, every bit helps in ensuring sustainable practices.